
Creating a New View
Creating a New View
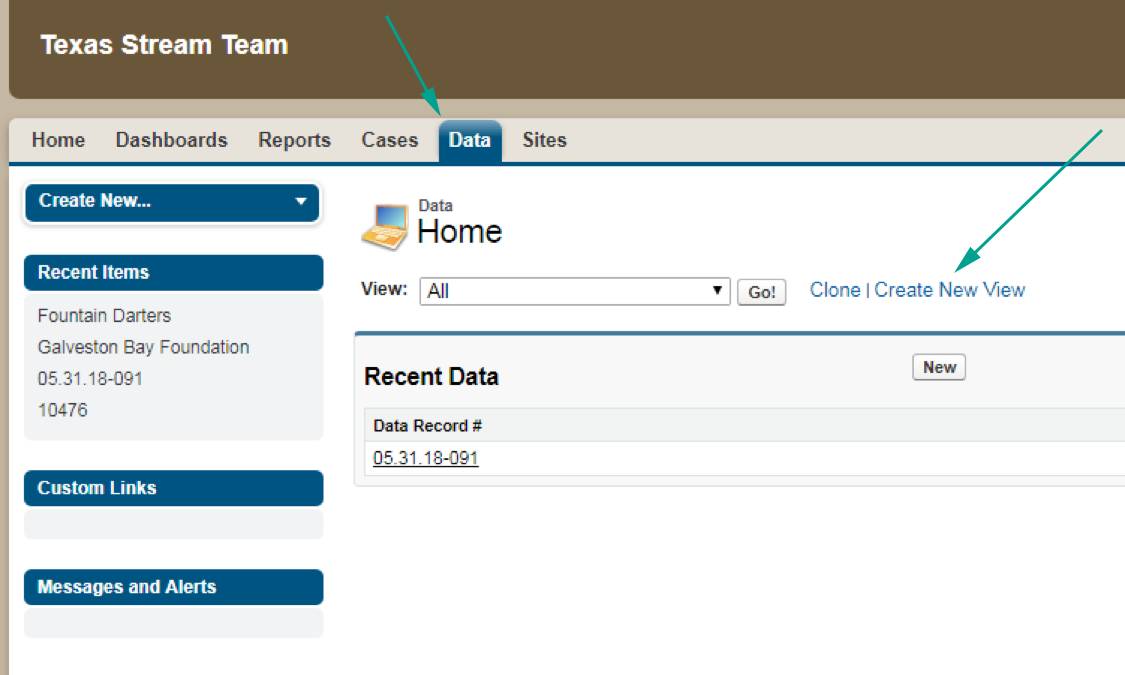
Step 1
Creating a View starts on the Data Tab. Select Create New View to begin customizing your View.
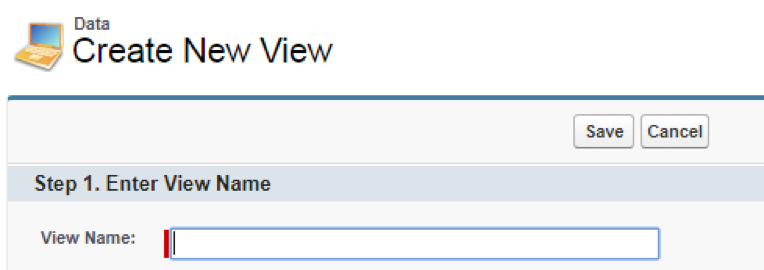
Step 2
Enter the name you wish to give your custom View. This field is mandatory.
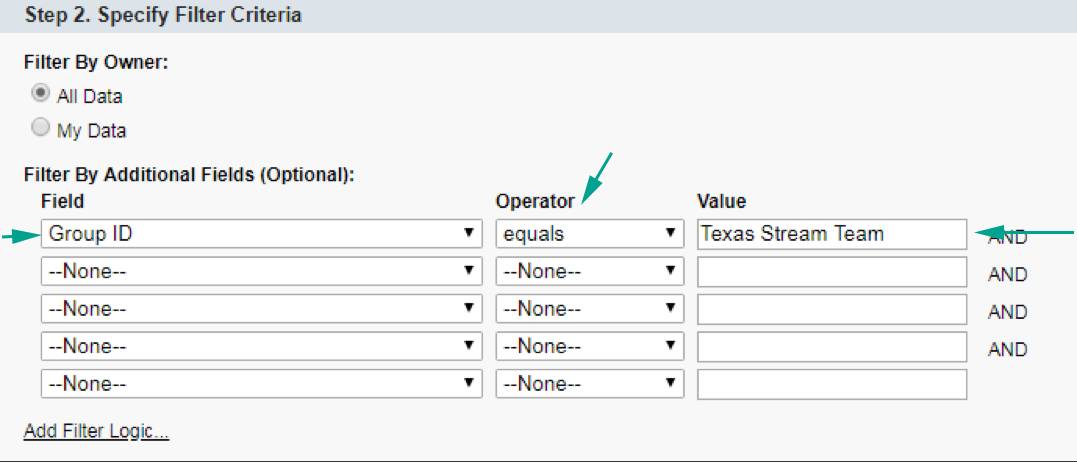
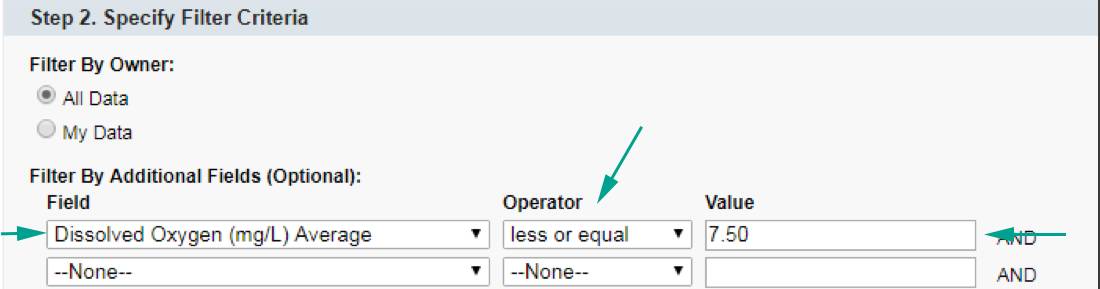
Step 3. Specify Filter Criteria
Select All Data to capture data from the entire set of Texas Stream Team data. Select My Data if you are only interested in data you have entered.
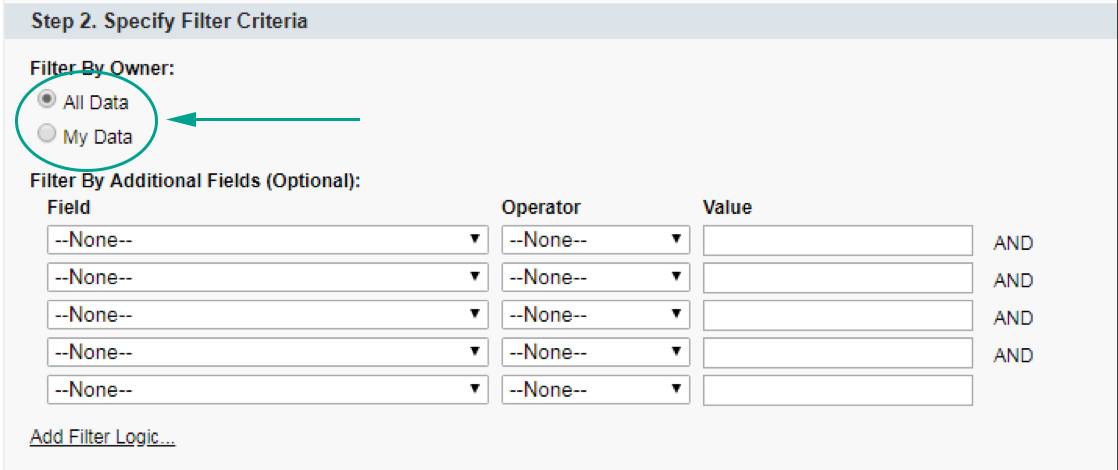
The Filter By Additional Fields section is optional and allows you to define a filtering parameter for your data results.
If you have a Group account and wish to view data collected by your group, select Group ID in the Field column. The operator defaults to equals. Enter your group name in the Value column. Alternatively, citizen scientists should select the Field Citizen Scientist's Name(s) and enter their name in the Value column.
Step 4
This step is where you select the specific data you wish to see.
After Record ID (which is the unique identifier given to each data sheet entered), the fields are listed in alphabetical order. One at a time, select the fields you wish to display, clicking the Add button in between the Available Fields and Selected Fields column. Once you have all the desired fields, you can order them using the Top, Up, Down, and Bottom buttons on the right. A field can be removed from the Selected Fields list by selecting it and clicking the Remove button.
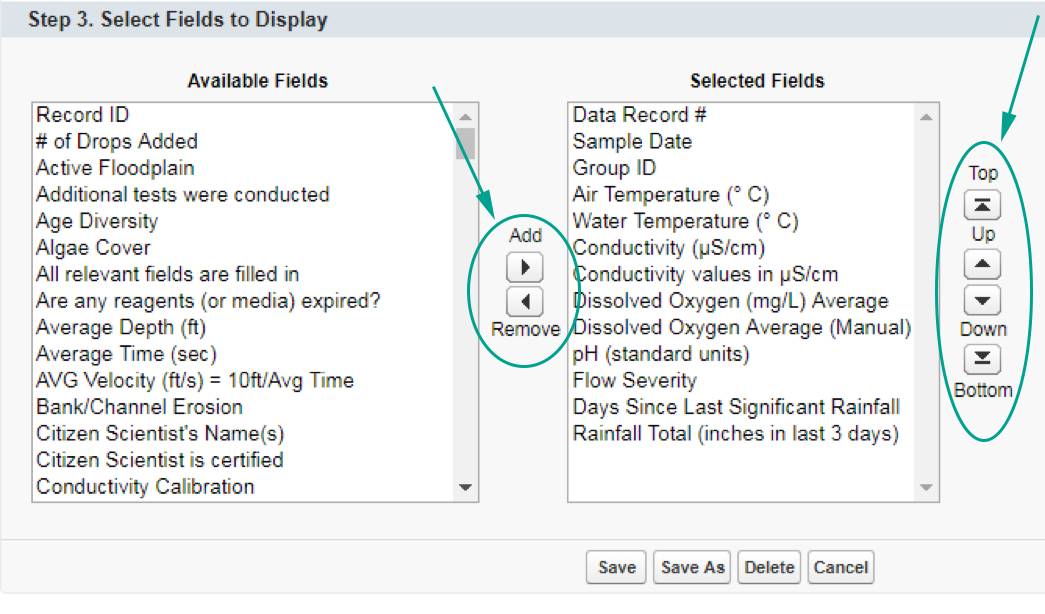
When you are done, click the Save button to save your View.
Additional Information
1. Once you save the View, you can go back and edit or delete it.
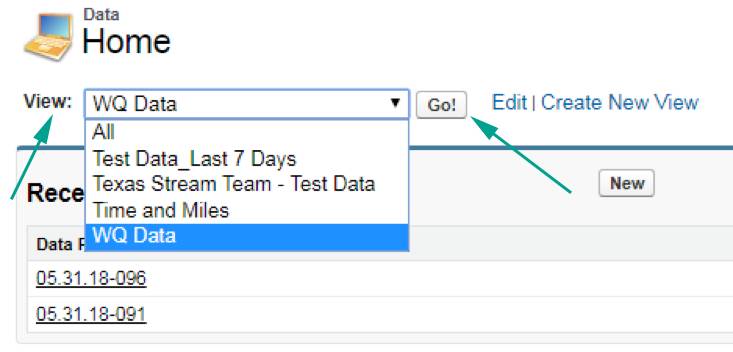
2. The Data tab allows you to select and order water quality data fields of your choosing. When a View is set up, you can select it in from the View drop-down menu and click Go!. The default view is data you have entered or interacted with recently.
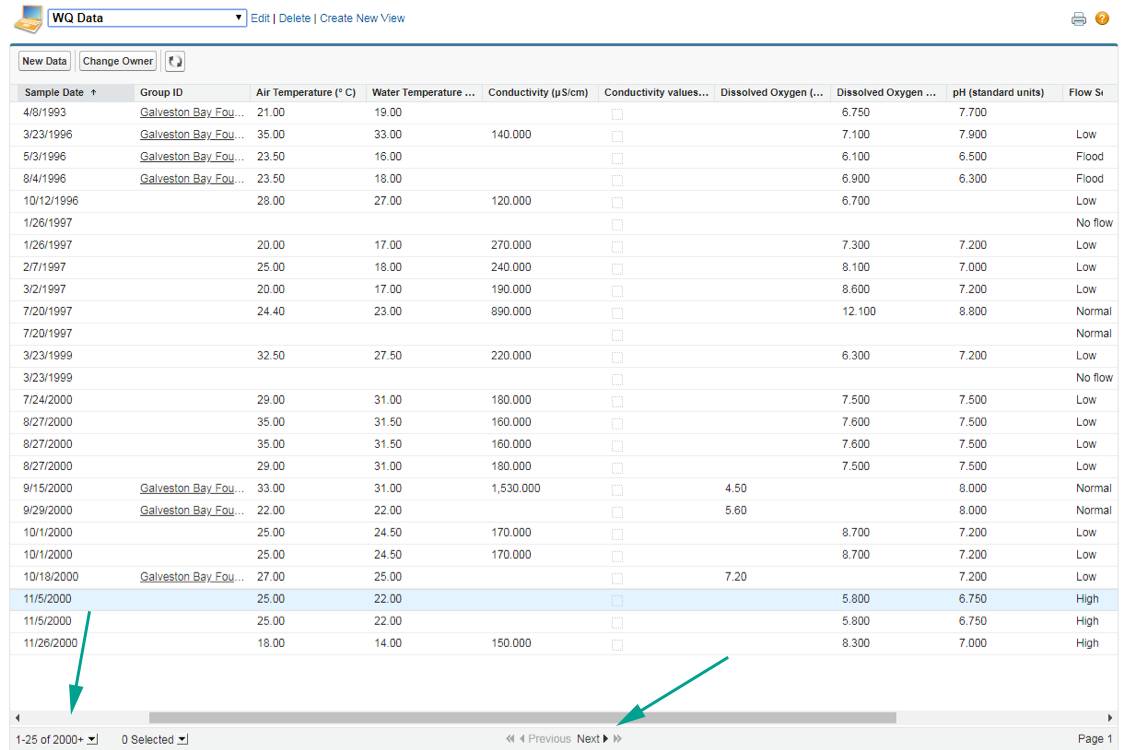
You can change the default number of records that are displayed (10, 25, 50, 100, or 200) and click Next to advance through the results pages.
3. Once you are comfortable with creating a new View, you can get creative and experiment with the Filter By Additional Fields options. For example, you can create a View that displays samples with a low dissolved oxygen. In this case, set the Operator as “less or equal” and the Value as “7.50.”
Select the fields you would like to view in addition to dissolved oxygen, click Save, and view the results. You can add fields or make additional tweaks to the results display by clicking Edit. Columns can be sorted by clicking on the column header.